Lean Operations Toolkit
You know where the losses are. You need a structured way to size them, assign the fix and track it to closure.
Who it's for
This is for the person who owns the improvement list. You may run a line, a department or a whole site. You have losses everyone talks about and no single place that sizes them, ranks them, ties them to actions and shows whether the fix held.
Built for operations managers, CI leads and improvement teams on manufacturing sites.
Screenshots
Taken from the real files. All names, sites and figures shown are fictional example data. Select an image to see it full size.
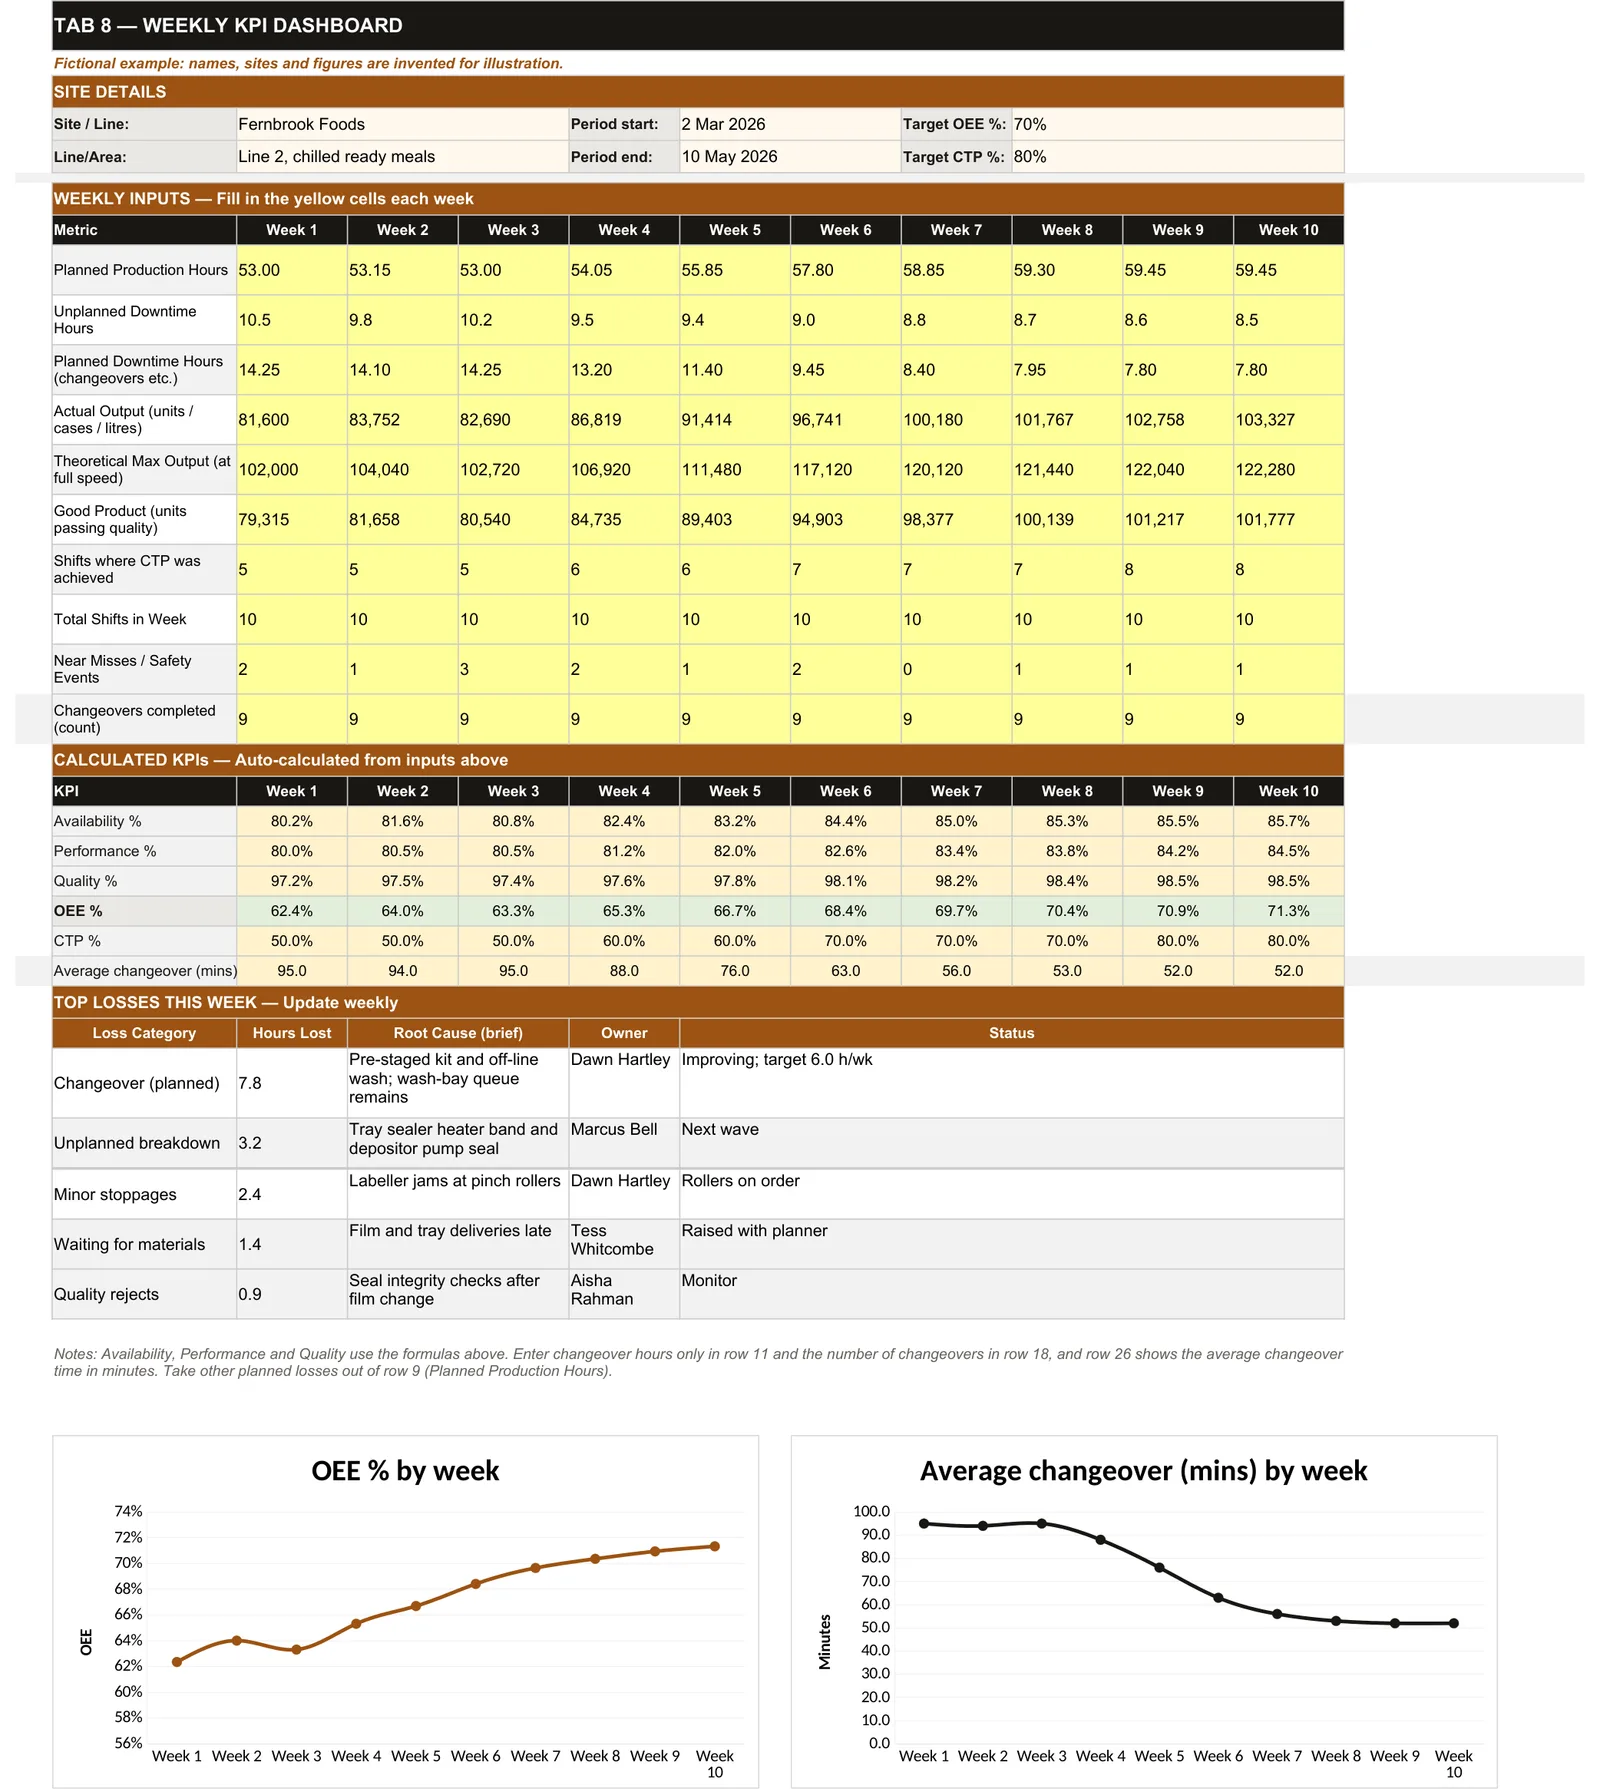
Tab 8, the KPI Dashboard, filled in with the fictional Fernbrook Foods example: ten weeks of inputs, calculated OEE and changeover time, top losses and two charts.
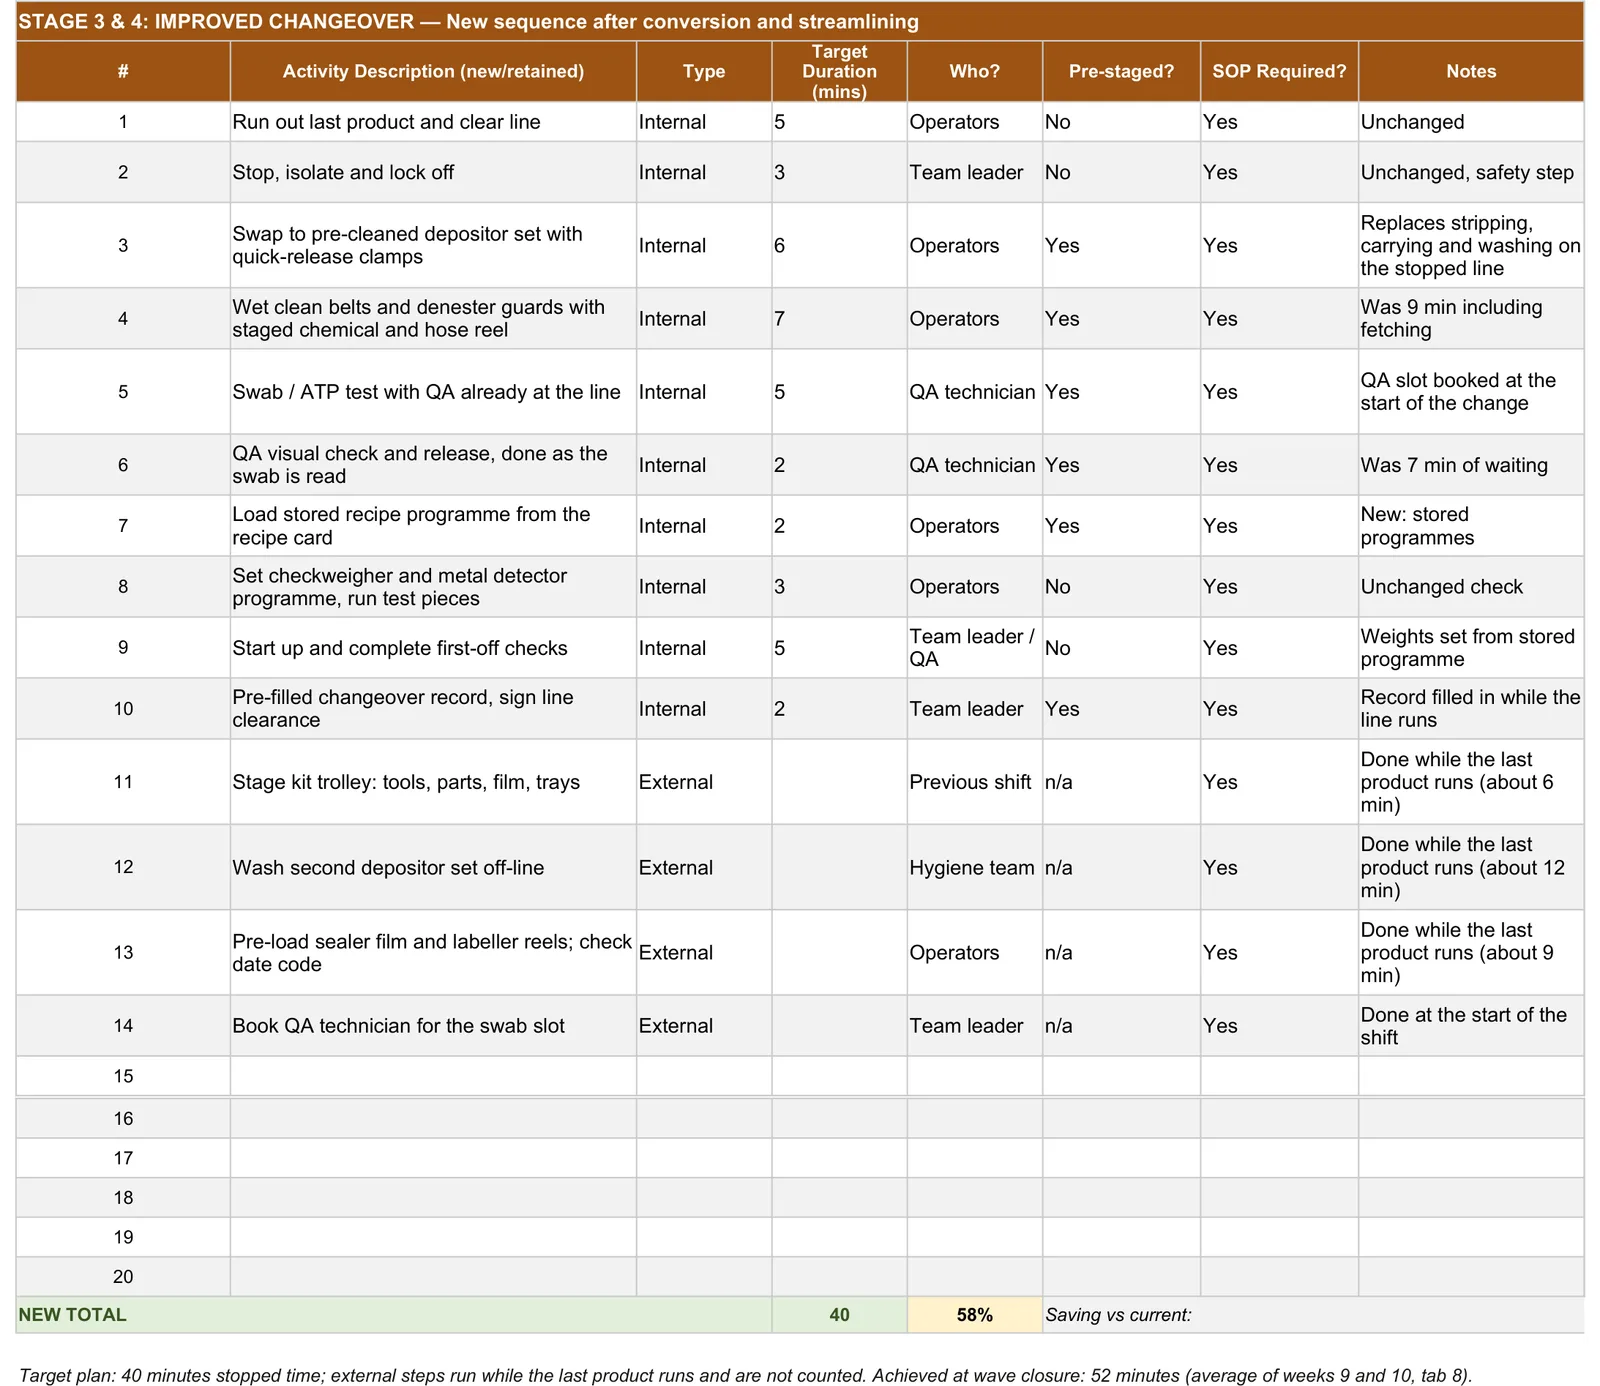
Tab 7, SMED Analysis, showing the improved changeover sequence in the fictional example.
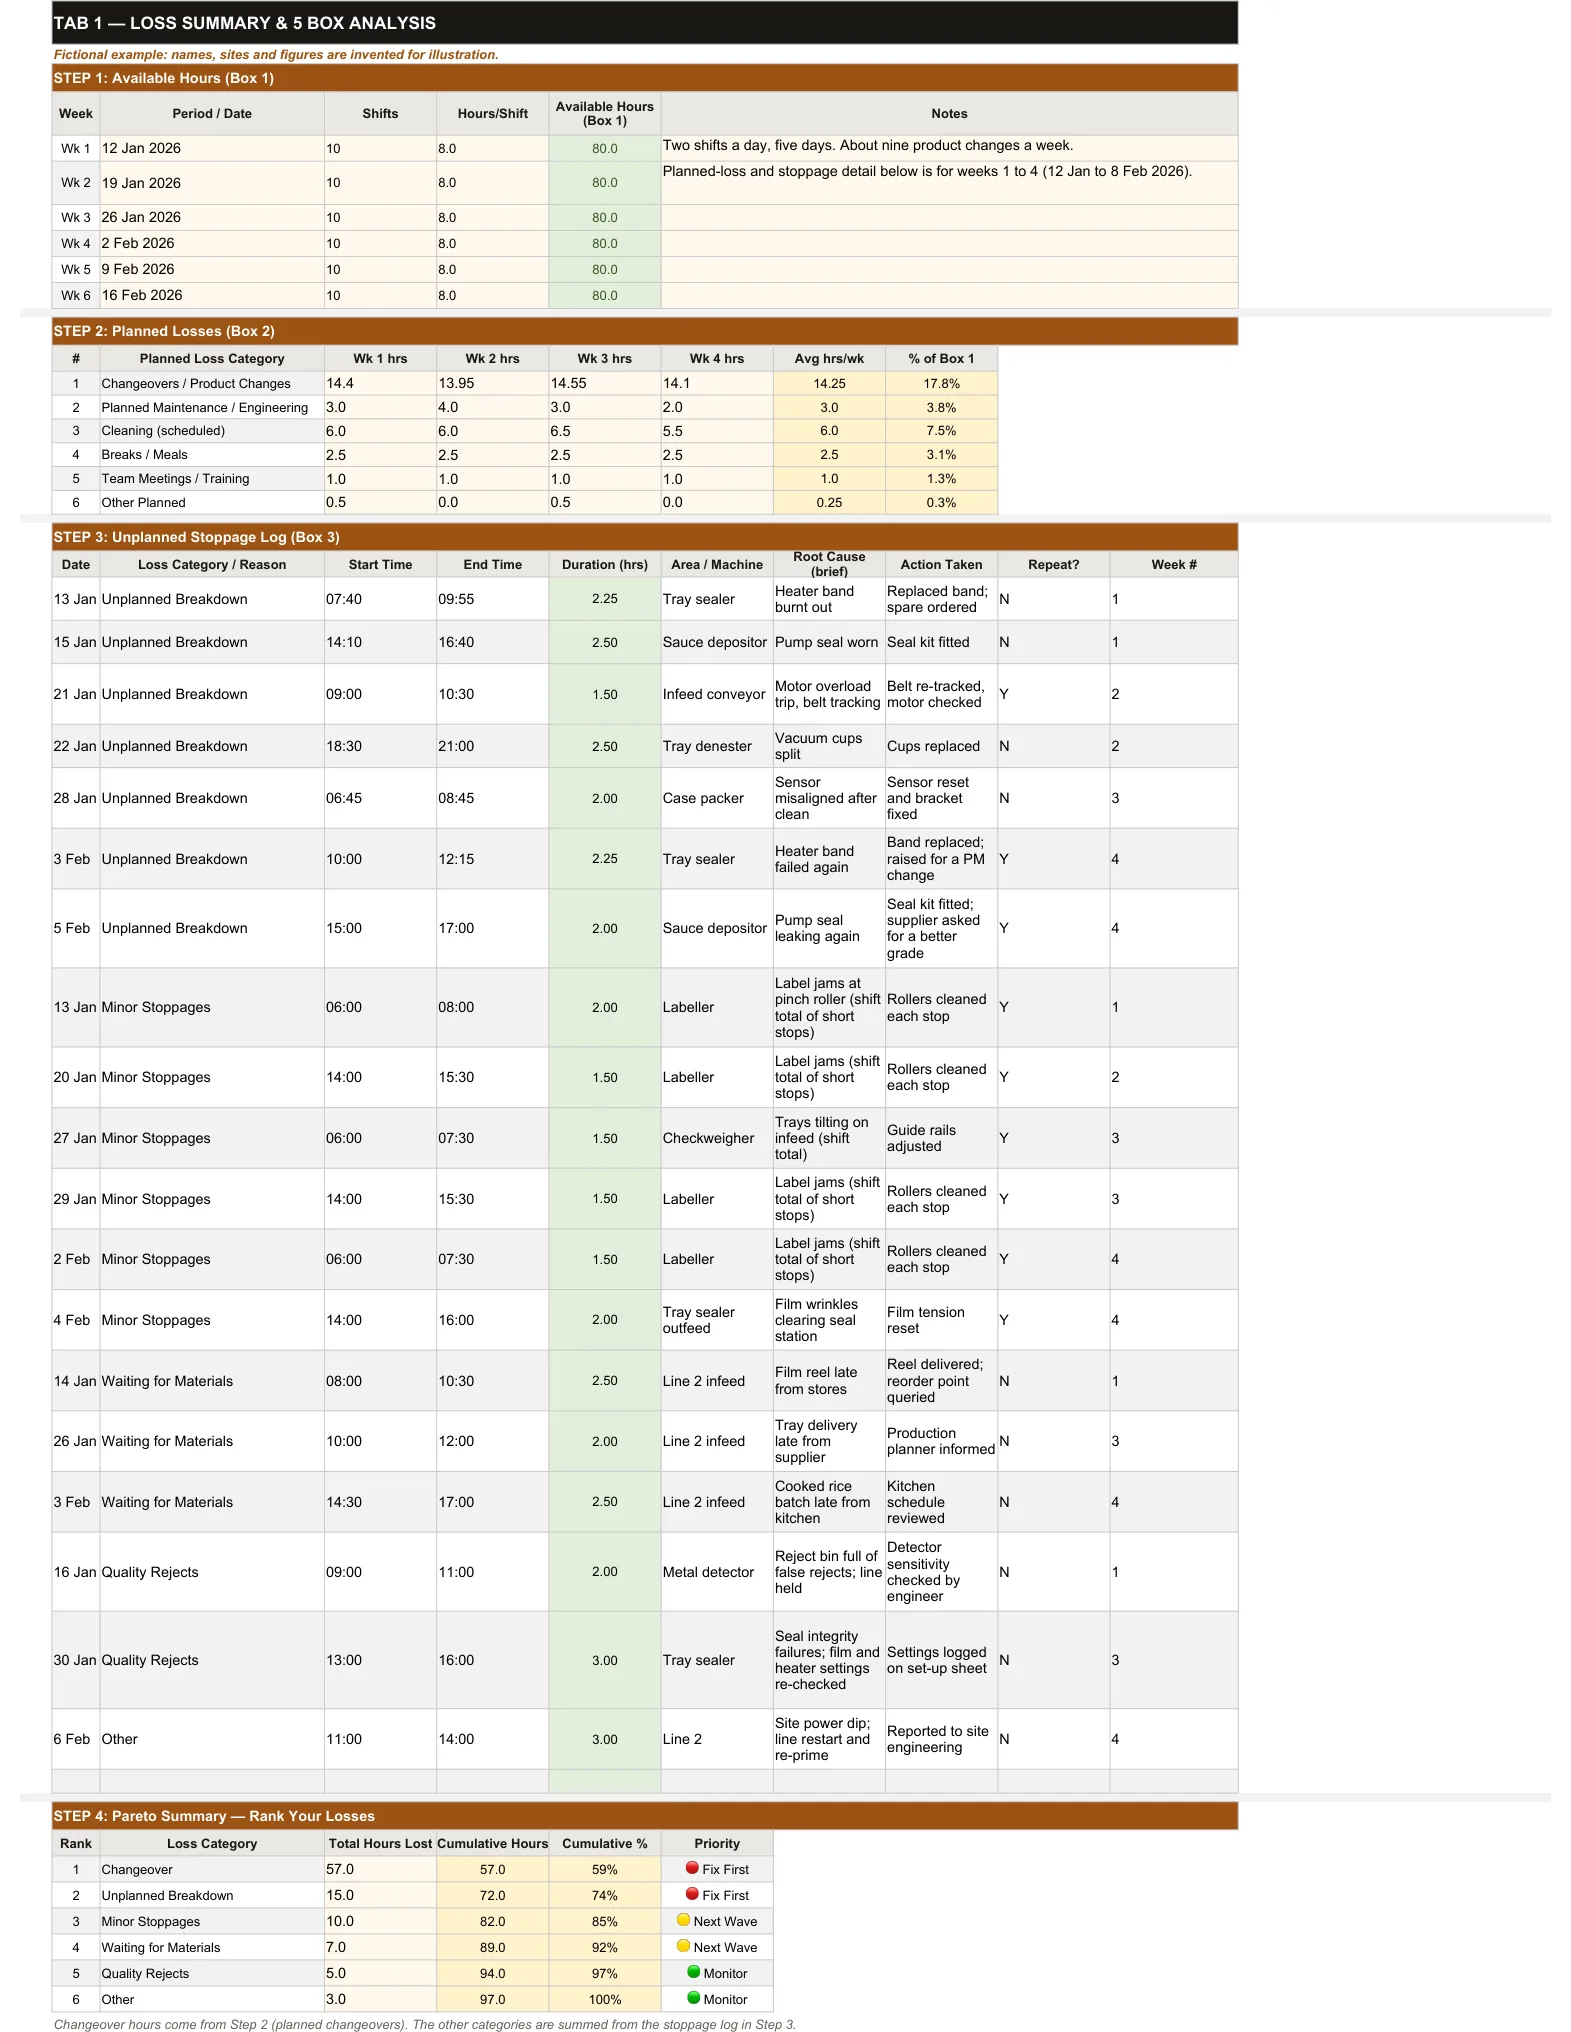
Tab 1, Loss Summary, with the fictional example data.
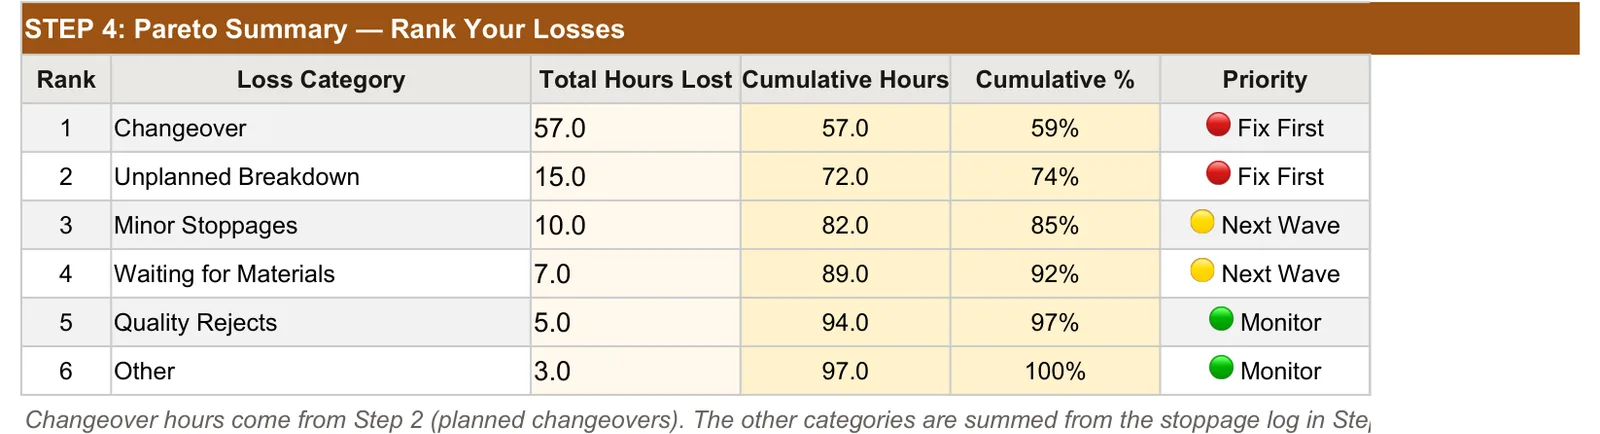
Close-up of the ranked loss Pareto in the fictional example.
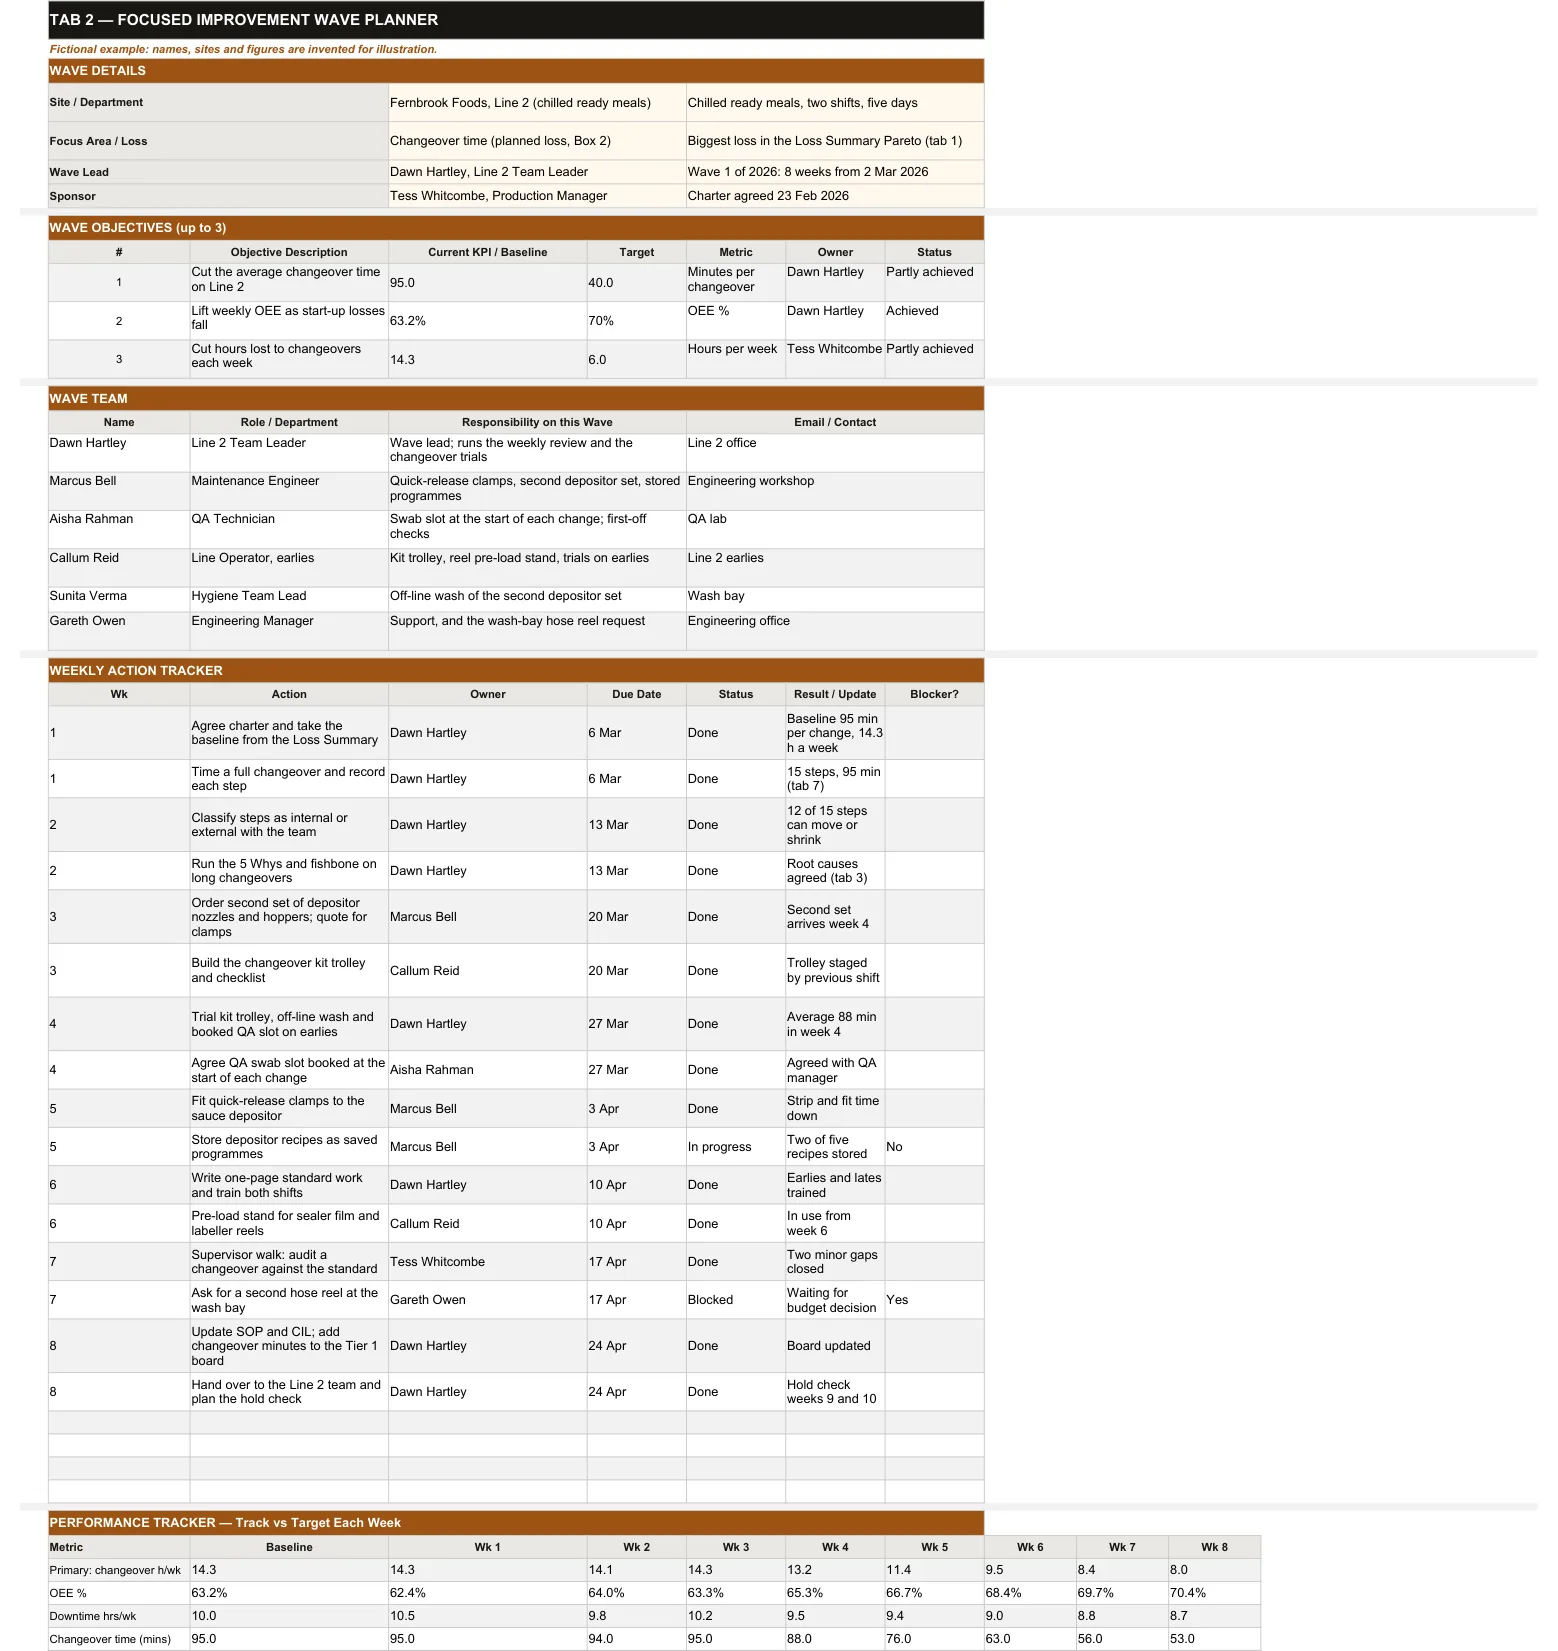
Tab 2, FI Wave Planner: objectives, team, weekly actions and performance tracker.
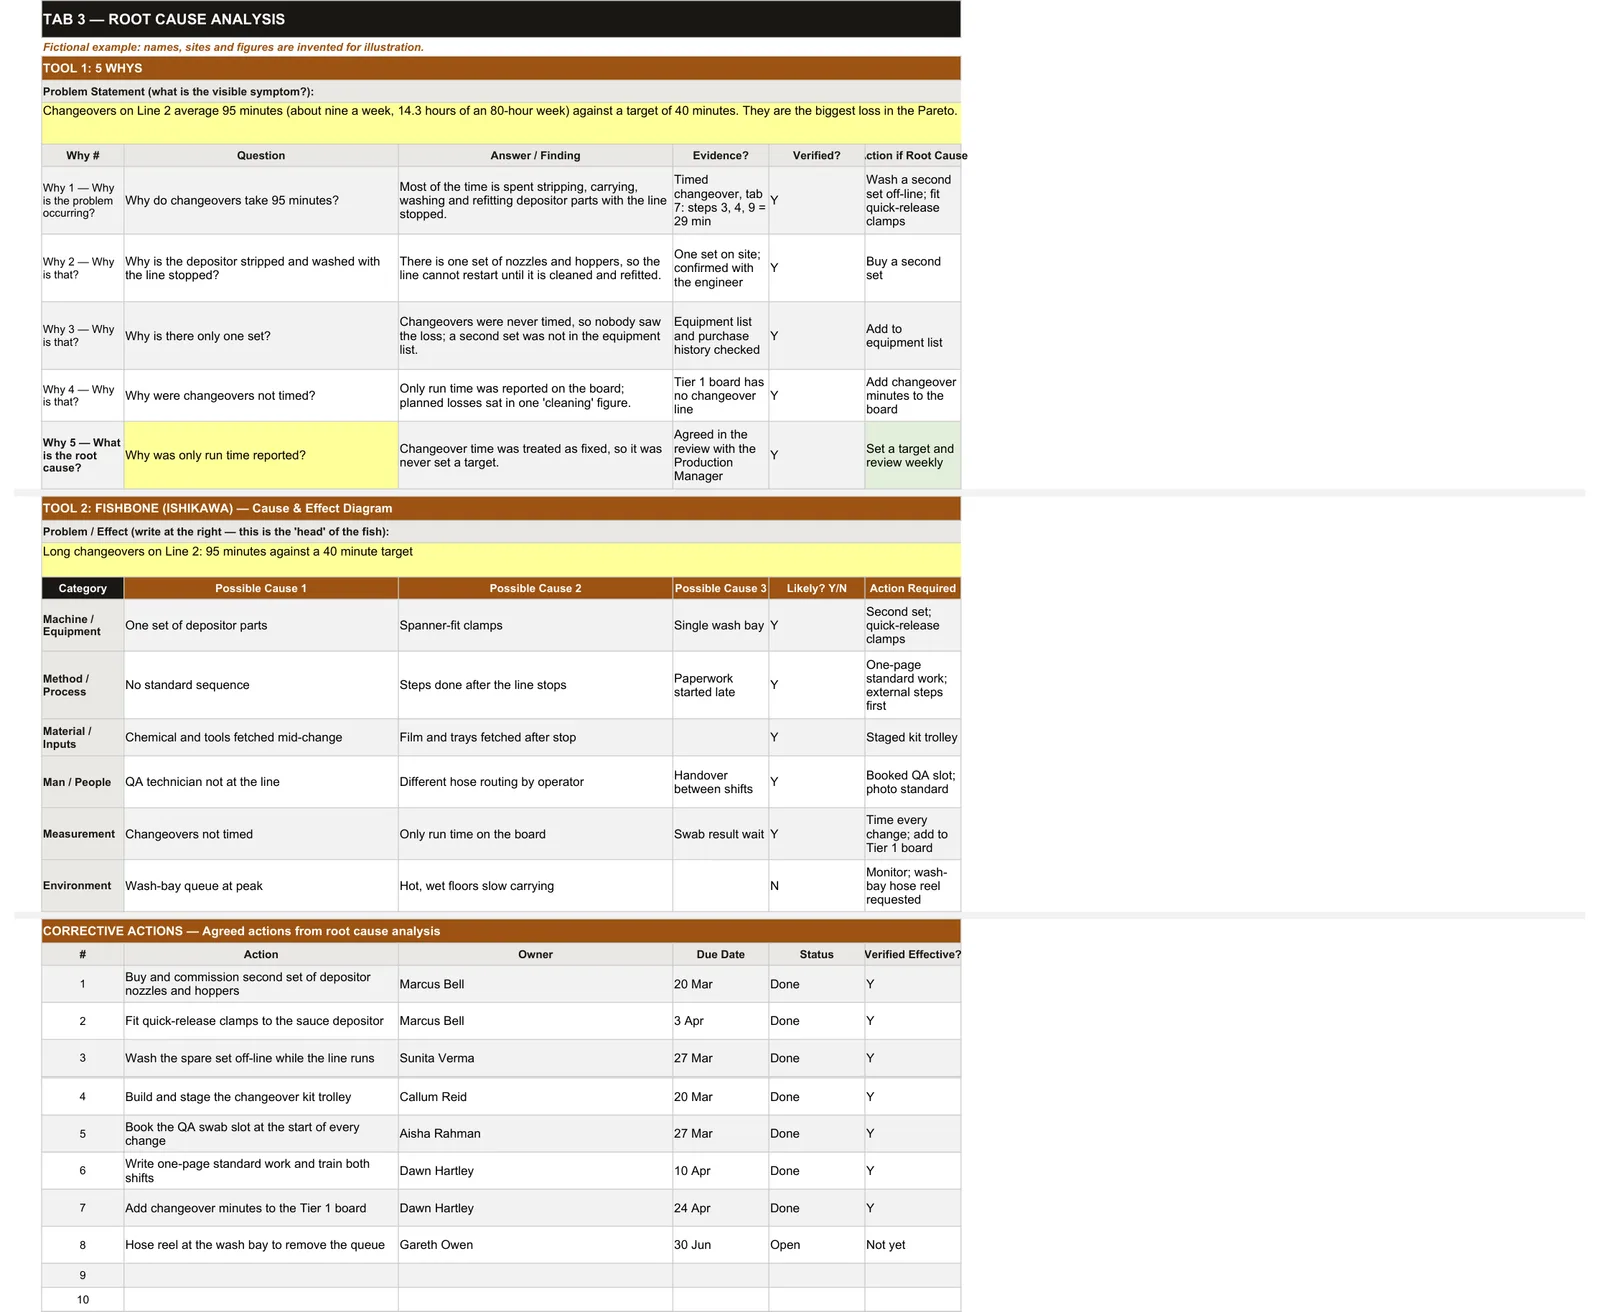
Tab 3, Root Cause Analysis: 5 Whys, fishbone and corrective actions.
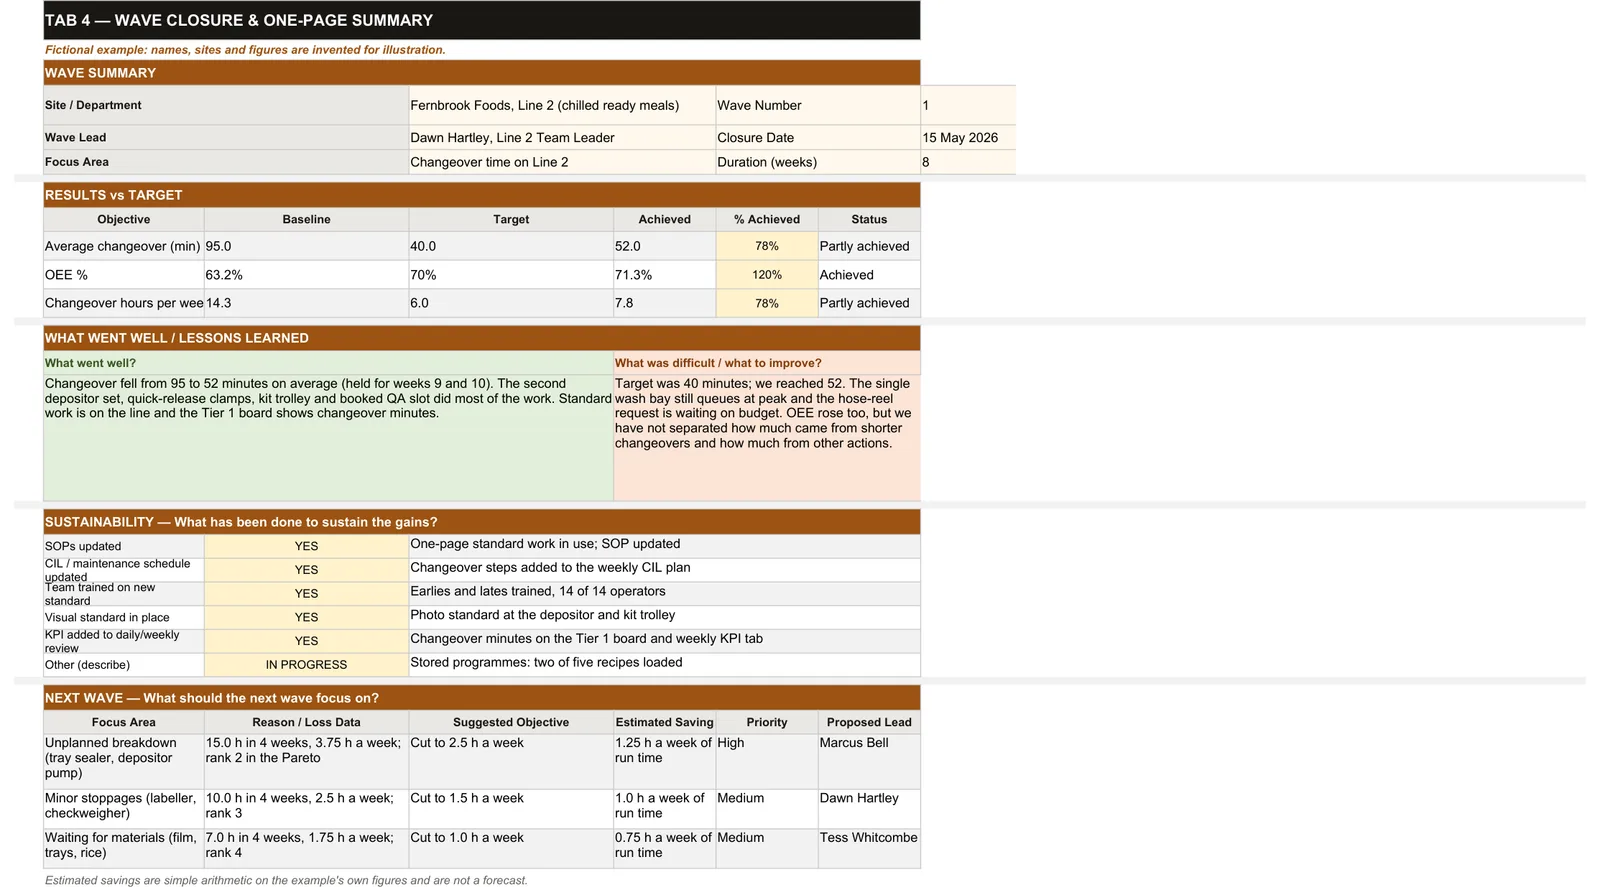
Tab 4, Wave Closure, recording the fictional wave as partly achieved.
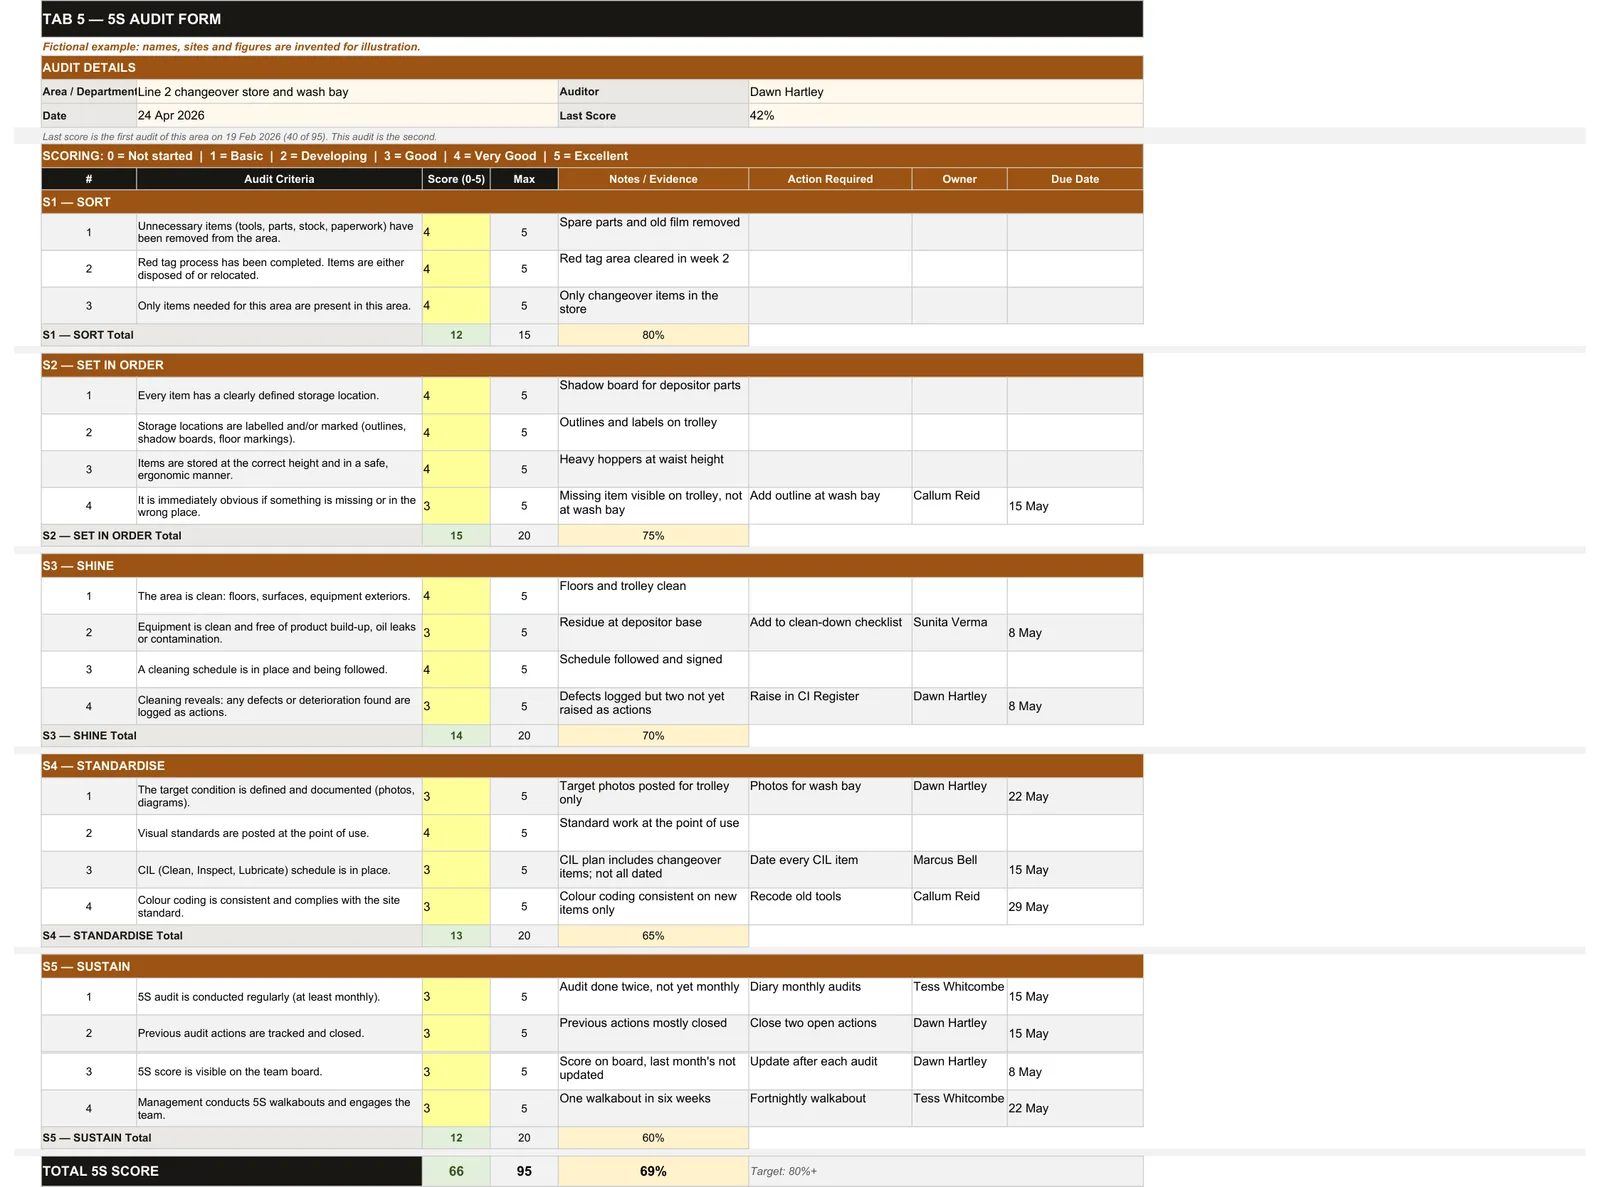
Tab 5, 5S Audit: 19 criteria scored 0 to 5.
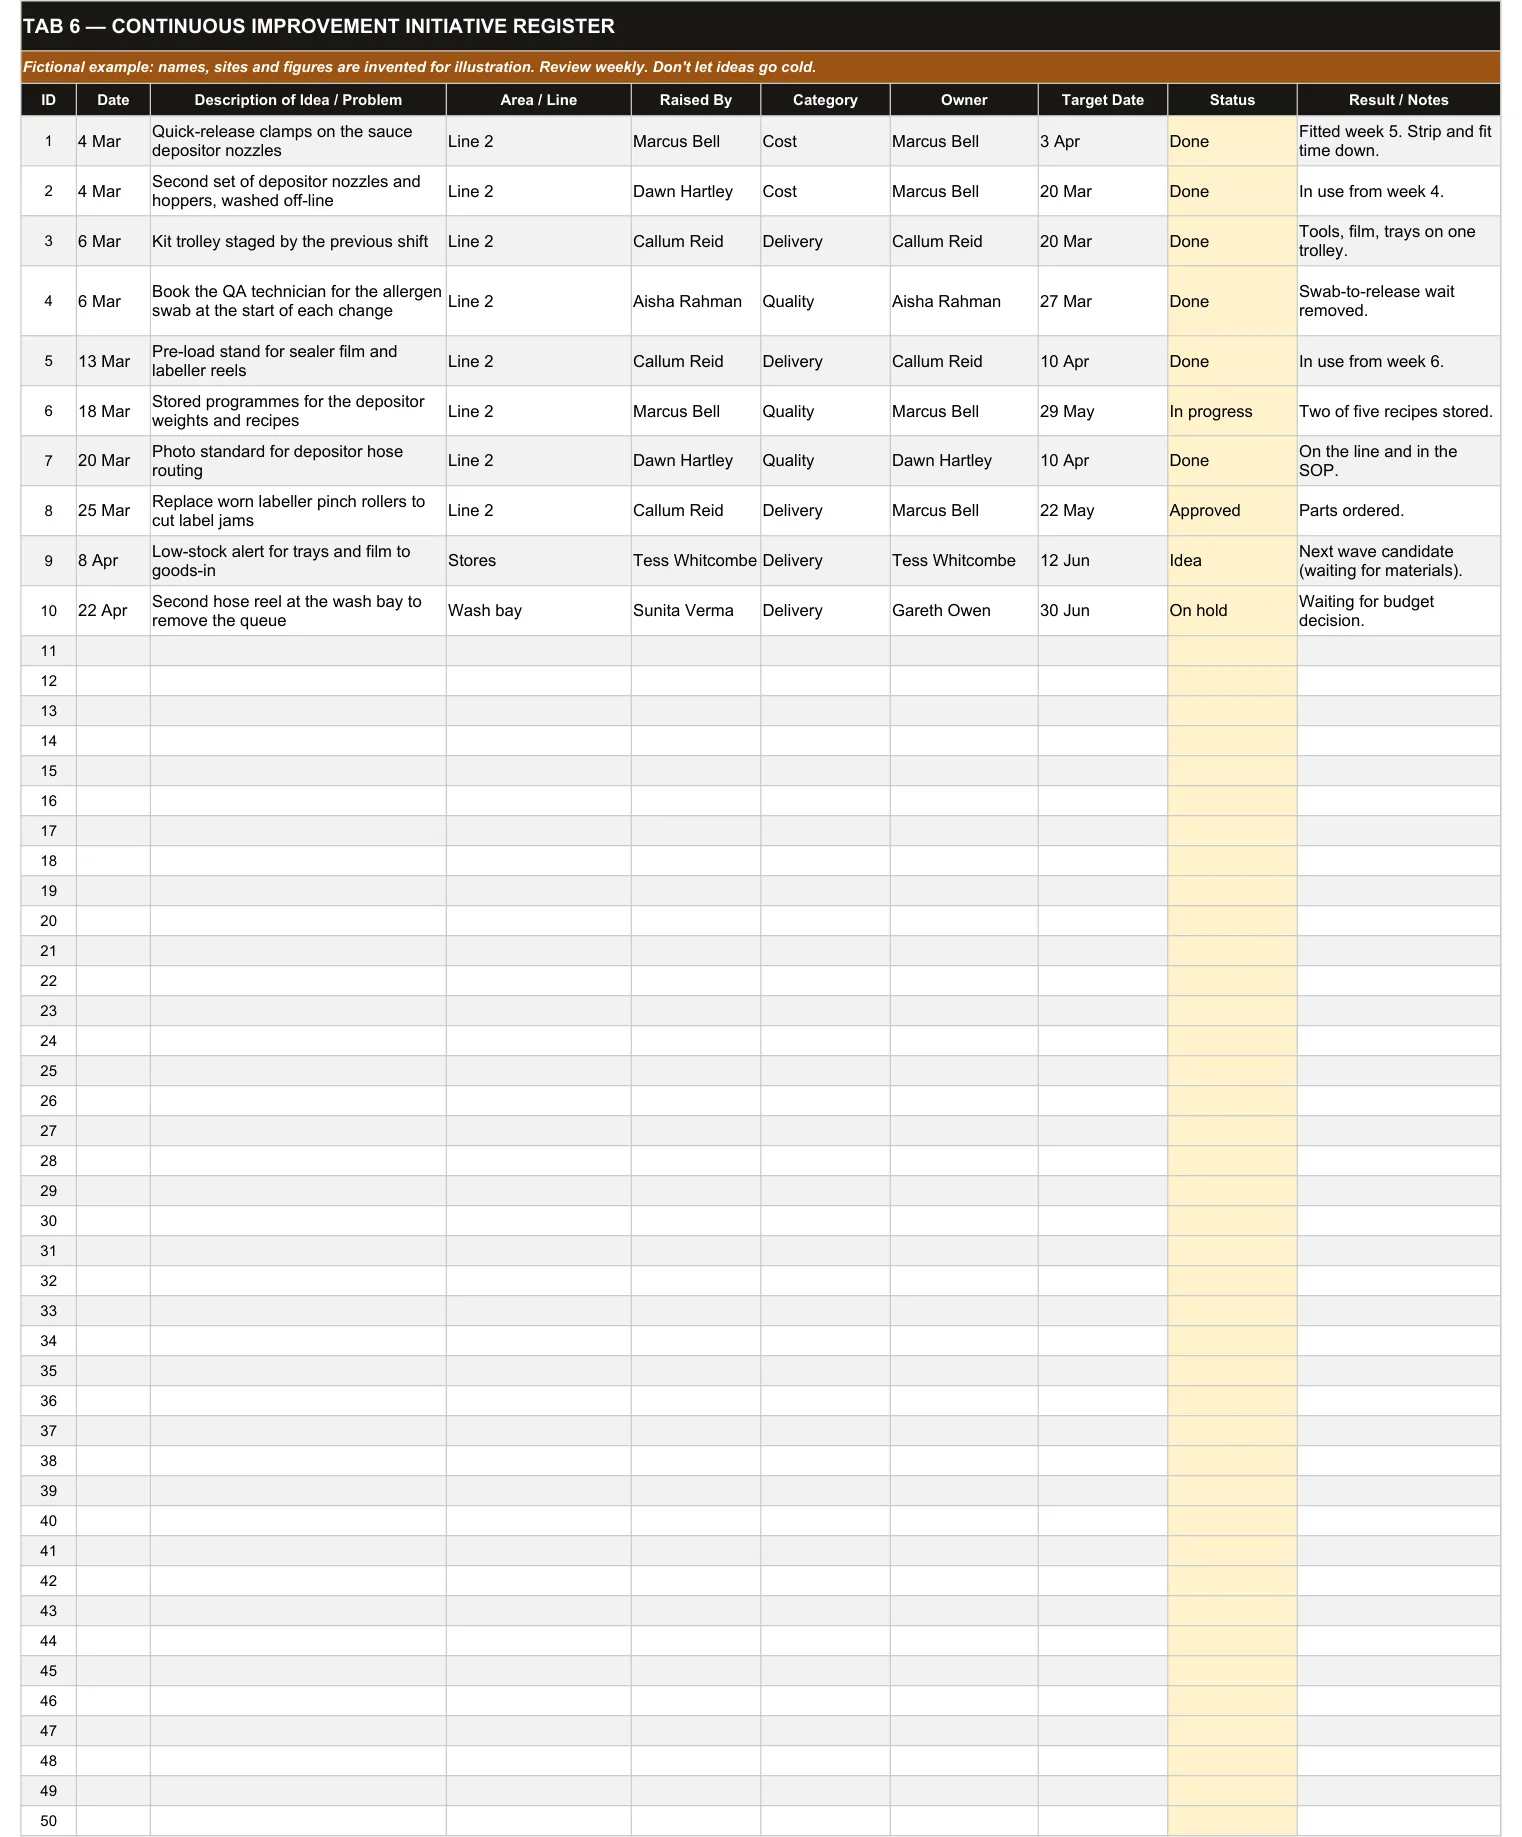
Tab 6, CI Register of improvement ideas.
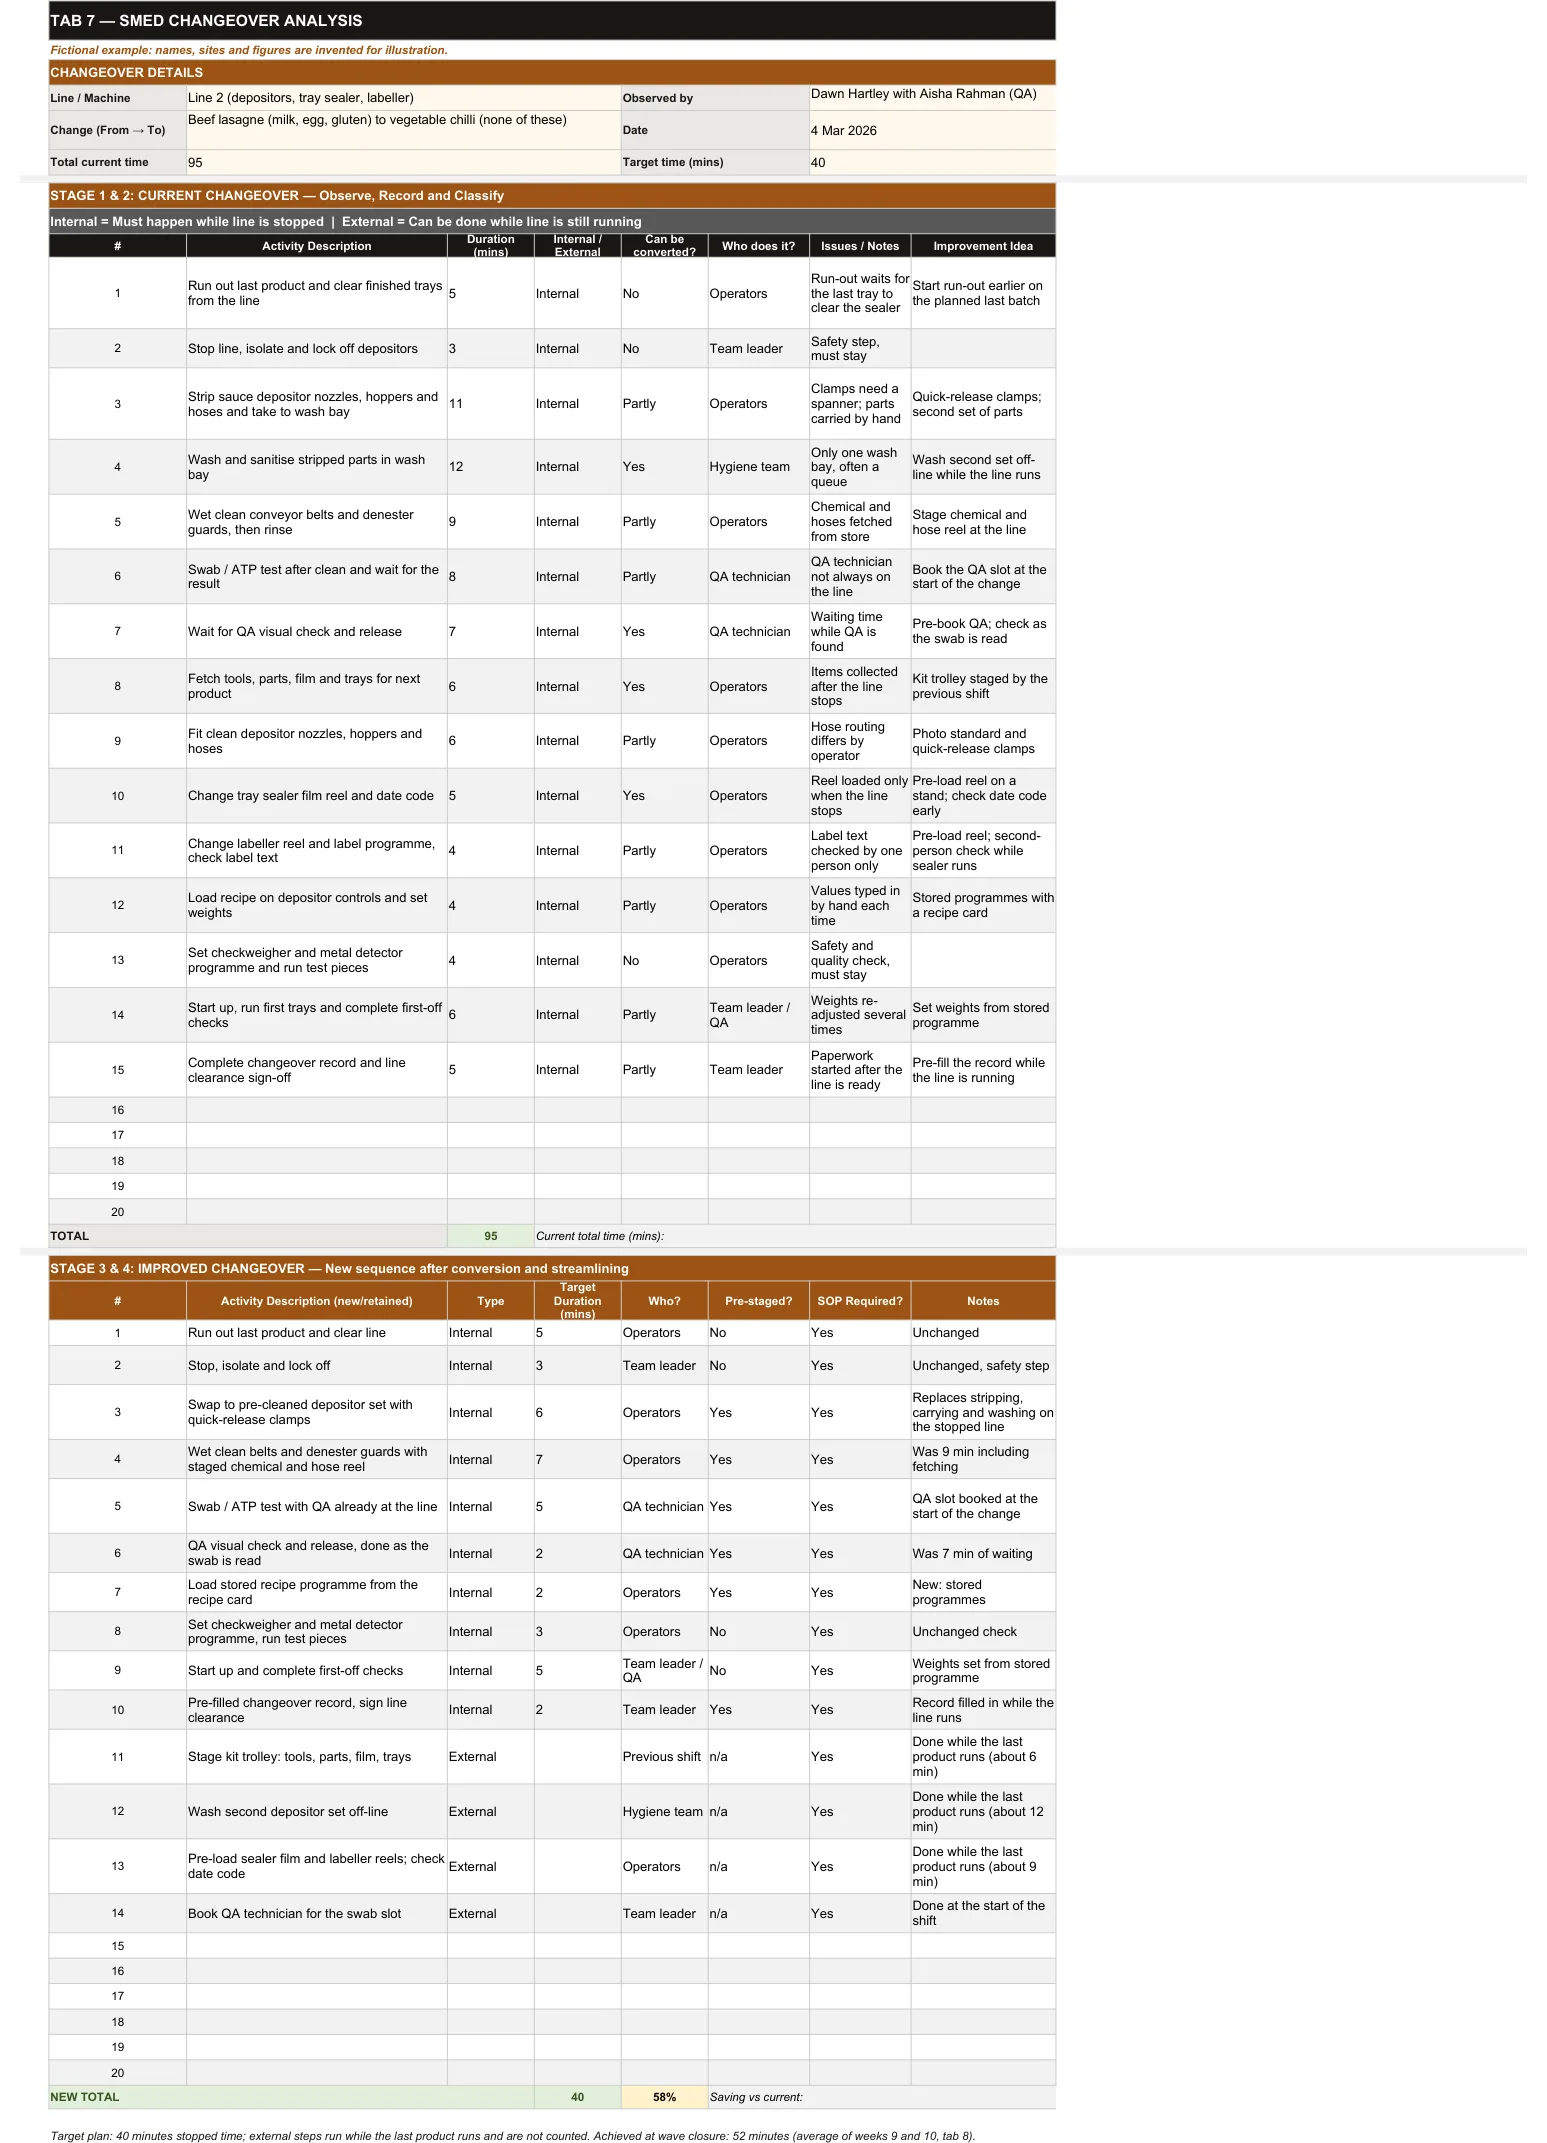
Tab 7, SMED Analysis in full.
What's included
Format: Excel workbook (.xlsx).
- 01 Tab 1 Loss Summary: available hours, planned losses, stoppage log, Pareto Lean Operations Toolkit - Blank.xlsx
- 02 Tab 2 FI Wave Planner: objectives, team, weekly actions, performance tracker Lean Operations Toolkit - Blank.xlsx
- 03 Tab 3 Root Cause Analysis: 5 Whys, fishbone, corrective actions Lean Operations Toolkit - Blank.xlsx
- 04 Tab 4 Wave Closure: results against target, sustainability, next wave Lean Operations Toolkit - Blank.xlsx
- 05 Tab 5 5S Audit: 19 criteria scored 0 to 5, total out of 95 Lean Operations Toolkit - Blank.xlsx
- 06 Tab 6 CI Register: improvement ideas from raised to done Lean Operations Toolkit - Blank.xlsx
- 07 Tab 7 SMED Analysis: changeover steps, internal and external, new sequence Lean Operations Toolkit - Blank.xlsx
- 08 Tab 8 KPI Dashboard: weekly OEE, CTP and changeover time with two charts Lean Operations Toolkit - Blank.xlsx
- 09 Worked example: Fernbrook Foods, Line 2 (fictional), all eight tabs filled in Lean Operations Toolkit - Worked Example.xlsx
- 10 Quick-start guide (4 pages) Lean Operations Toolkit - Quick-start guide.pdf
- 11 Licence and README LICENCE.txt and README.txt
You download one ZIP. It holds a blank workbook for your own data, a separate worked example, a guide and the licence.
Fictional example
The worked example: Fernbrook Foods, Line 2
A separate file with all eight tabs filled in for a fictional chilled ready meals line, two shifts a day, five days a week. It is an illustration of how the tabs connect, not a result and not a benchmark.
- Loss Summary: six weeks of 80 available hours. Planned changeovers rank first in the Pareto, at 57.0 of 97.0 hours over four weeks.
- FI Wave Planner: an eight-week wave from 2 March 2026 aimed at changeover time, from 95 minutes to a 40-minute target.
- Root Cause Analysis and SMED: the 5 Whys leads to one set of depositor parts. The SMED study times 15 steps totalling 95 minutes and plans a 40-minute sequence that moves washing, fetching and booking off the stopped line.
- KPI Dashboard: average changeover falls from 95 to 52 minutes by weeks 9 and 10, and weekly OEE rises from 62.4% to 71.3%.
- Wave Closure: recorded honestly as partly achieved, 52 minutes against the 40-minute target. The next waves are breakdowns, minor stoppages and waiting for materials.
- 5S Audit and CI Register: audit scores go from 42% to 69% against an 80% target, and the register holds ten ideas, six of them done.
How you'd use it at work
A realistic first week.
- Monday Skim the worked example for a few minutes to see a filled-in version, then open the blank workbook. On Loss Summary, enter last month's loss figures in the 5-Box layout and read the Pareto. Agree with your team which loss to attack first.
- Tuesday Plan the first improvement wave for that loss on the FI Wave Planner: owner, dates, the measure you will watch.
- Wednesday Run a 5 Whys session on the shop floor with the people who live with the problem. Capture it on the Root Cause Analysis tab, with a fishbone if the causes branch.
- Thursday If the loss is a changeover, time one on the SMED tab and split the steps into internal and external. Otherwise audit one area with the 5S tab.
- Friday Log every action on the CI Register with a name and a date. Set the weekly numbers on the KPI Dashboard so next Friday starts from a baseline.
Compatibility
Tested in Microsoft Excel for Mac (16.x), where every file opens without a repair prompt, and in LibreOffice 26.2, where the workbooks recalculate with no formula errors. The formulas use only functions available since Excel 2007, so Excel for Windows 2010 or later should work, but we have not tested it on Windows. Google Sheets and Numbers: not tested. No macros, add-ins or external links.
Licence
Single organisation. Adapt the files for internal use. No resale, and no sharing outside your organisation. Read the licence.
Delivery
Instant download after checkout. Gumroad emails your receipt and download link; files stay in your Gumroad library.
Support
Questions before or after you buy: cadencestandard.co@gmail.com. Refunds are 14 days, no questions. See the refund policy.
Worked examples use fictional data. The files support your own judgement and are not legal or professional advice. See the disclaimer.